This week’s FOMC rate decision will set the tone for markets over the next couple of months. There’s a lot of voices speaking up, and it feels like every FinTwit participant has turned into a Fed expert. Many of these big accounts are just clout farmers who will post anything bullish to gain a few followers.
But here in the Tank, we use data to our advantage instead of emotions...
50 BPS
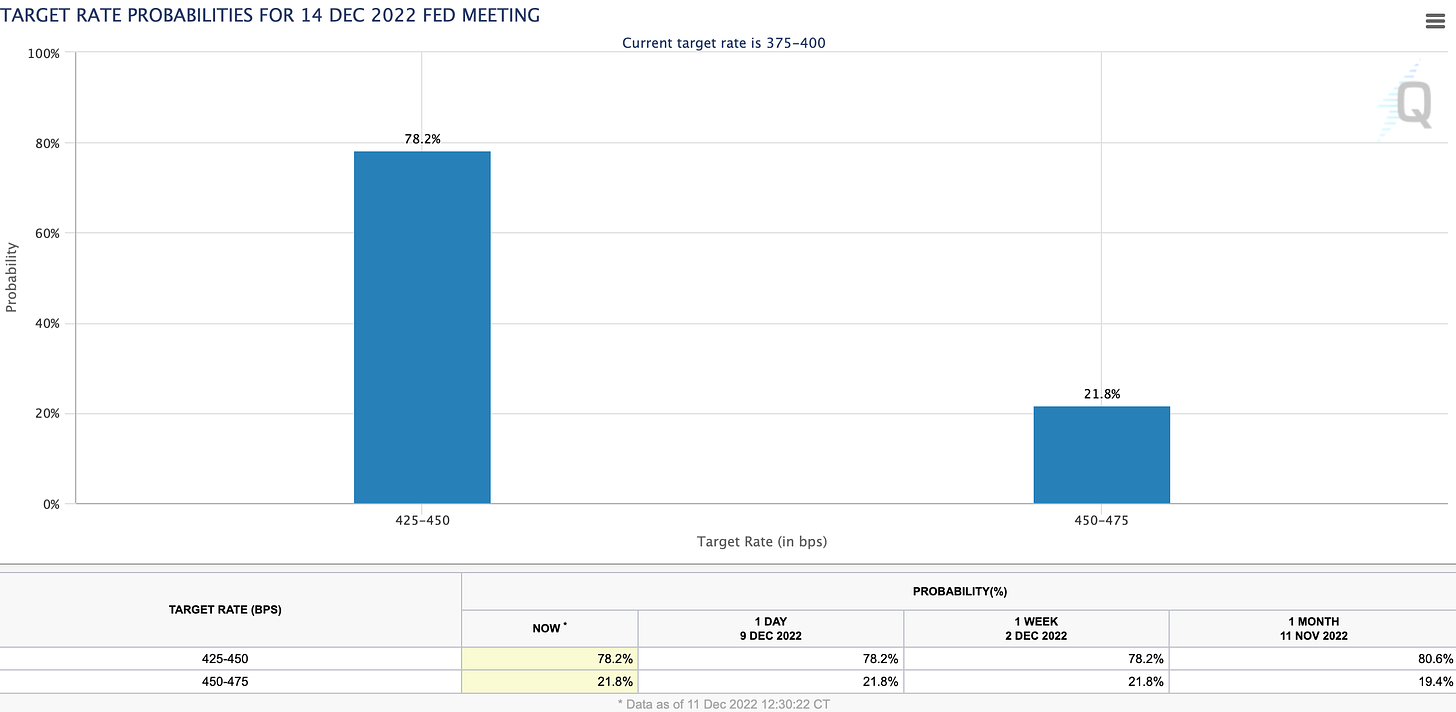
Currently the market is pricing in nearly 80% chance of a 50bps hike on December 14. That would put the target range for the federal funds rate at 4.25-4.5% for December.
Granted, we still have CPI (Tuesday) to contend with before the final decision comes down. CPI and PCE are the two main inflation components that the Fed takes into consideration. Everything else is small in comparison.
Dot Plots to Shift Higher
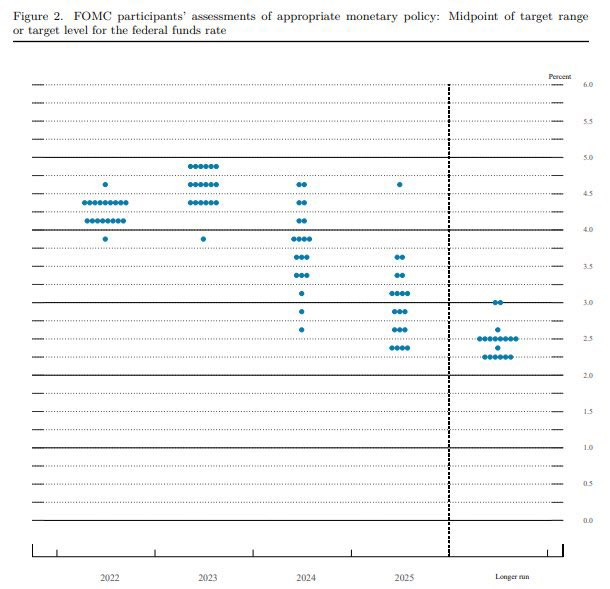
The median rate forecast for 2023 should move up by 50bp to 5.125% at the time of the release. This would be a slightly higher quarter-on-quarter revision. Here’s September’s dot plot for reference.
Powell’s Determination
It’s reasonable to expect Fed Chair Powell to shoot down the notion of easing financial conditions. Remember, a slower pace of hikes does not mean a lower terminal rate, and that’s why investors need to be careful here.
Even if the Fed stops raising borrowing rates from March onward, that doesn’t mean it will instantly start going backwards. There will likely be a period of at lest 2-3 months where nothing happens unless the labour market and overall economy start to really tank in early 2023.
CPI
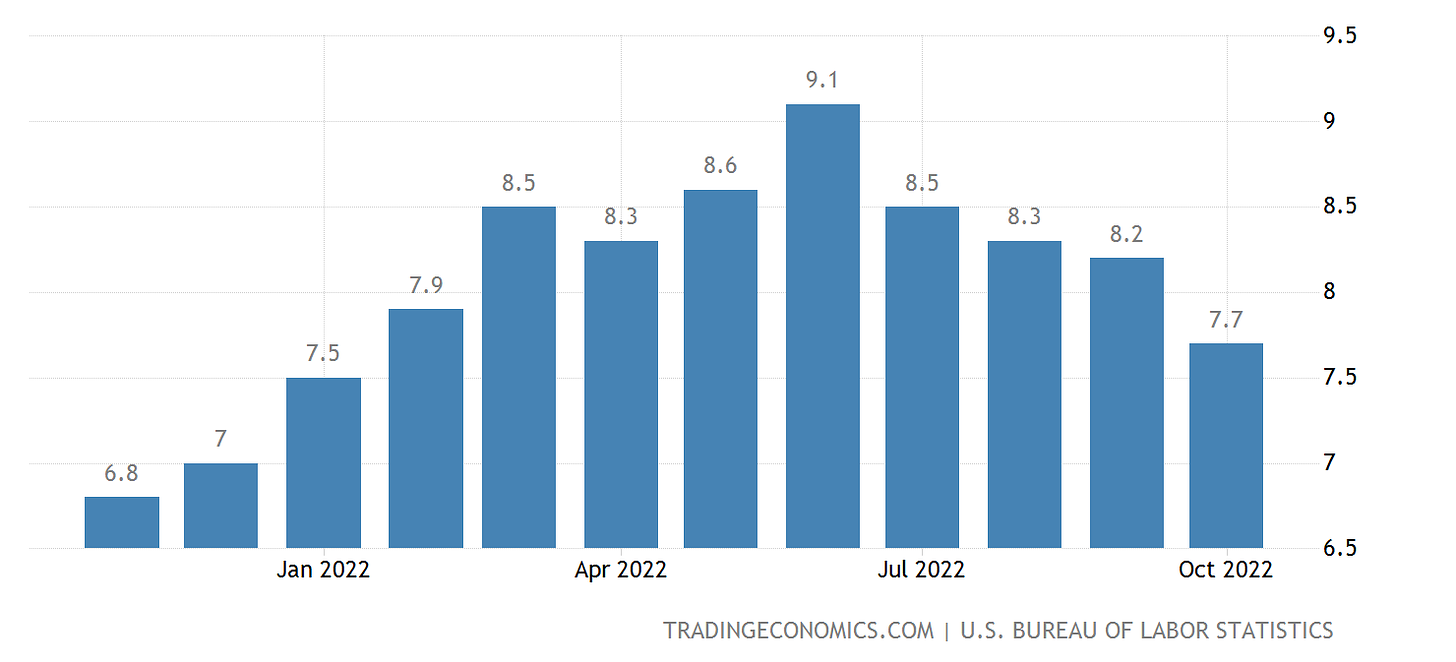
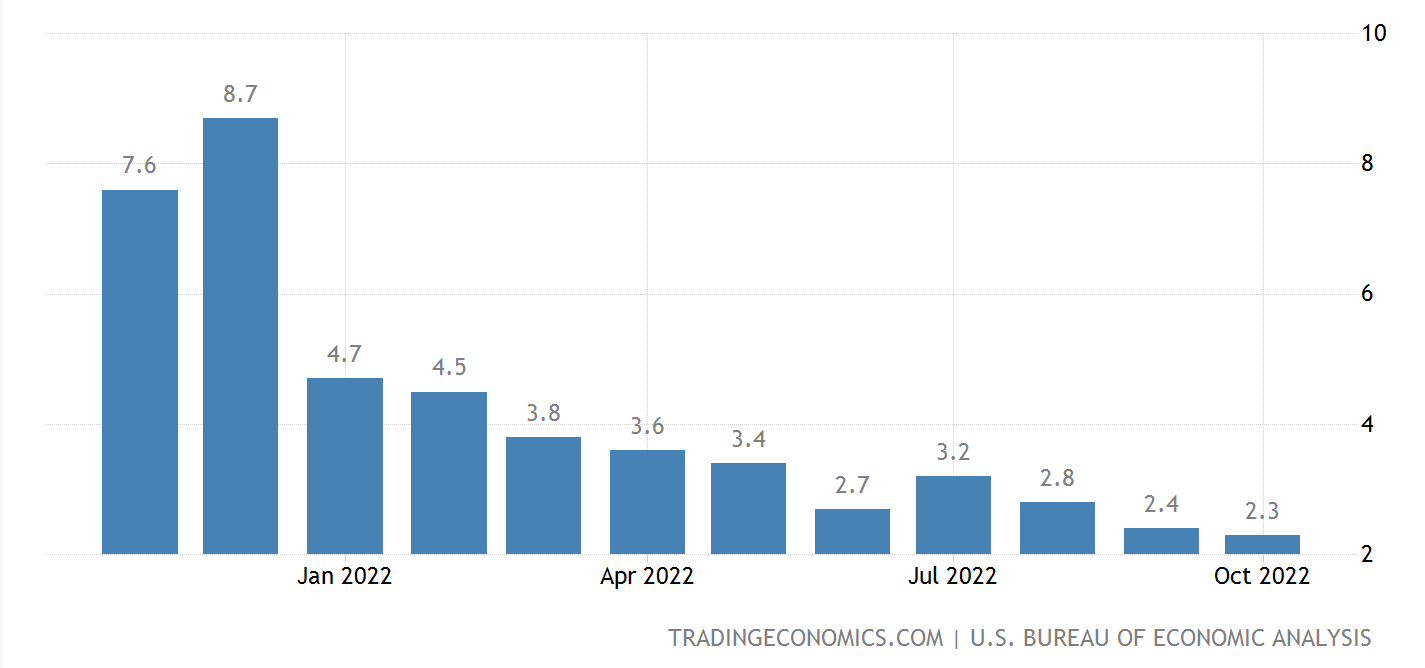
Here’s where I would warn about potential early-week excitement from bulls. Expectations are for November CPI to dip from 7.7% down to 7.3%. Core CPI is expected to show a rise of +0.3% vs. +0.3% MoM and 6.1% vs. 6.3% YoY.
Taking recent data into consideration, a rise in core CPI seems likely, and I expect a relatively hot print.
If the opposite happens and we get a cool print, especially on core CPI for November, this will create short-term strength in risk assets (stocks, crypto).
Due to our base scenario where we get a 50bps hike and Powell remains hawkish, any rally likely gets quickly sold into. This is typical FOMC-week behaviour.
Here’s the 12-month trend on CPI
Retail Sales
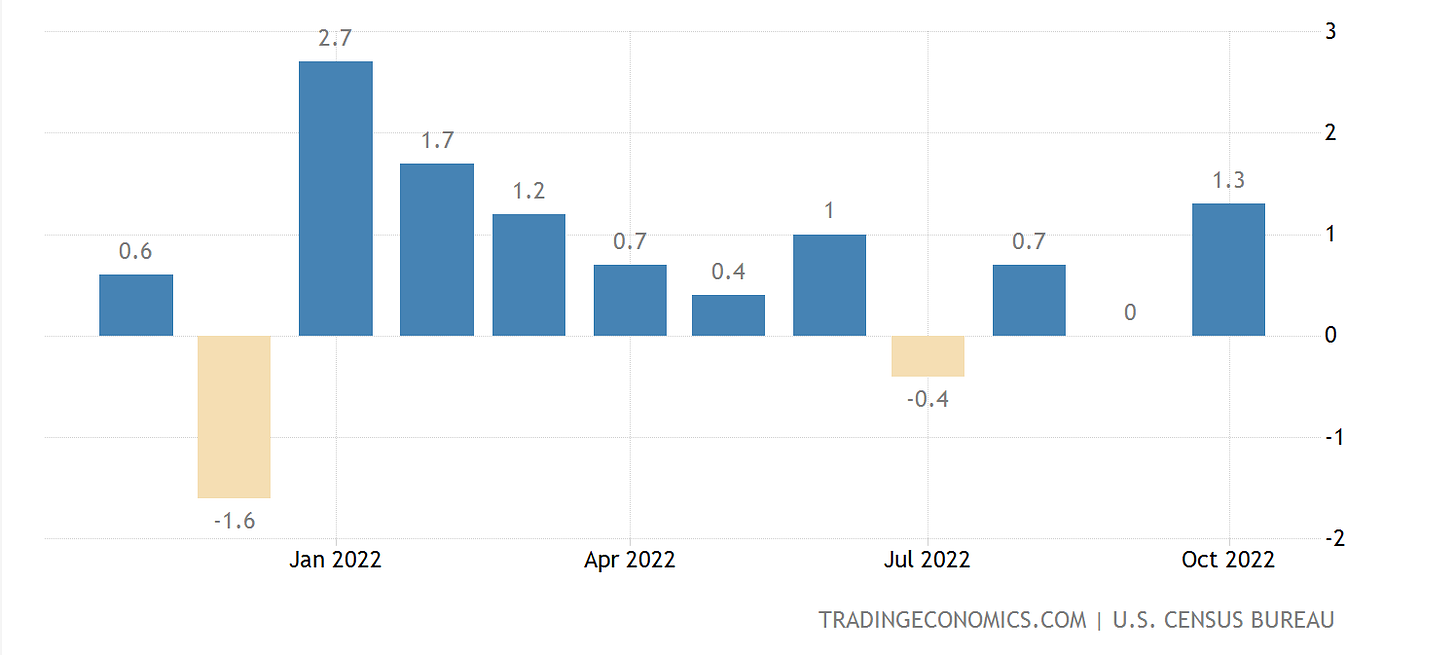
Here’s the other big one this week. The numbers aren’t out til Thursday, so they’ll have a comparatively lower effect on the market. Retail sales can be a bit erratic. August showed a huge jump over July, and October rose a massive 1.3% above September.
October data showed resiliency in consumer spending, despite high inflation and rising borrowing costs. Yet forecasters are expecting November’s figure to dip into negative territory once again with -0.3% expected.
Here’s where I’d make a case for retail sales to beat expectations, simply due to last week’s Services PMI numbers coming in so hot. This shows big demand in the services economy (think food & beverage, hospitality). Stay tuned to find out if my theory holds true, or this turns out to be a misleading indicator.
Personal Savings Rate
But just how strong are American consumers in reality, and can households continue to spend at the rate they currently are?
One of the most interesting charts is personal saving rate as a share of disposable income. October’s print was the lowest since 2005 as pandemic-fuelled savings accounts disappear.
This is concerning as we enter 2023. When consumers run out of savings, will credit debt explode? And what happens when the labour market starts to tip over? These should be concerns for all investors.
Still, if the market manages to shake off all these events, it’s possible we could get an EOY rally. On Friday we looked at the crypto, SPY and US dollar charts. In case you missed that update, just head over to thetradingtank.substack.com.
We’ll do a chart review later in the week, so stay tuned!



Another great episode, thank you!!