


Bullish Selling or Bears in Control?
Chart Overview

Patience Pays
After calling the market bottom several weeks ago, my followers have been banking off altcoin moves. We’ve been watching the space closely, and right now we’re at a critical moment. To dispel some of the confusion over what’s going on, let’s take a look into what’s changed on the charts and where we currently sit.
Bitcoin 1D Chart
Locally we’re seeing some bullish consolidation with BTC, and the recent geopolitical tensions gave us a brief scare as the price dipped below 60k. However, I see a clean bounce from the 50-day moving average, with the next obvious upside target being the 200DMA if bulls have anything left in the tank. A successful reclaim of the 200DMA would have me targeting 66k area, followed by the diagonal resistance at 68k. On the downside, my line in the sand is 59k area. Closing a daily candle below there would not be good for the bullish case in the short term & we’d have to start talking about 55k, 51k targets but we’re a long way from that. I’m cautiously optimistic. Yesterday’s Nonfarm Payrolls report came in at 254k vs 140k consensus and 159k prior. The unemployment rate also ticked down from 4.2% to 4.1%. US stocks closed near ATH on Friday and this may lend to further strength. That said I am always wary of an early-week dip.

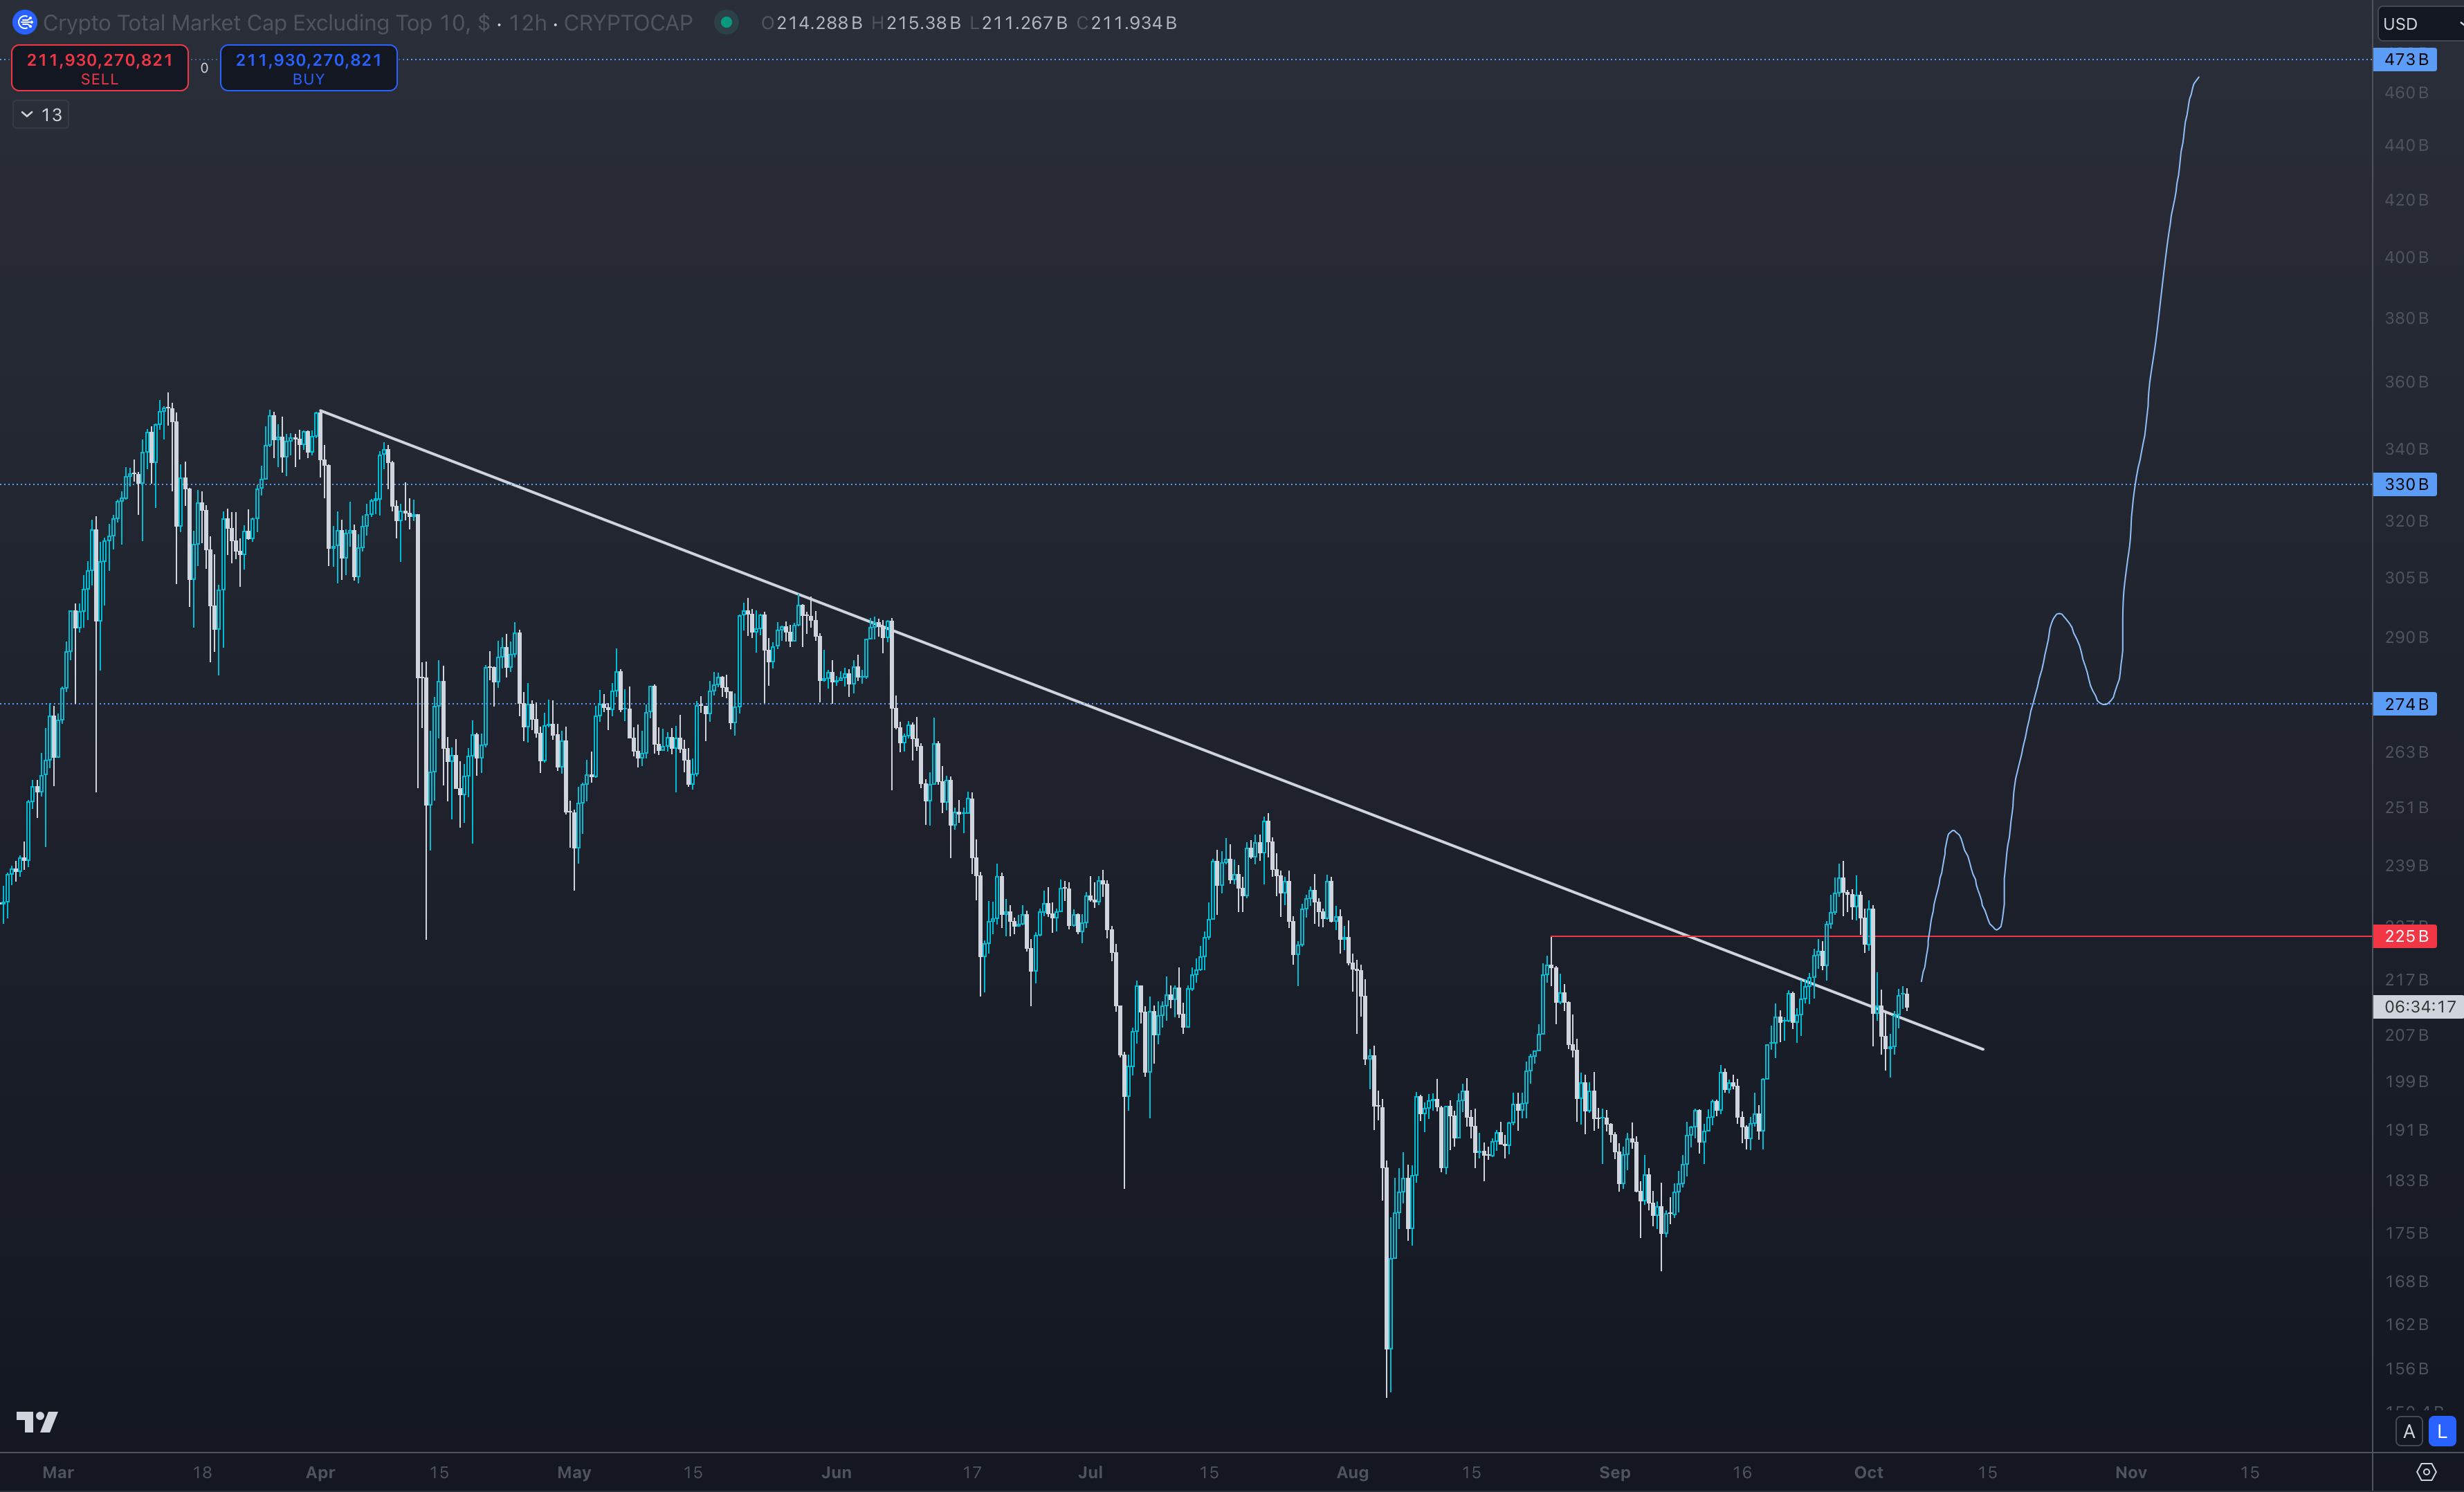
TOTAL3 Market Cap 12H Chart
We recently got a bit of a fake-out on the altcoin market cap chart. This was due to BTC dipping a little more than most expected. However the trend-line retest looks fairly decent right now. Last weekend the price action was painfully slow across the market. This time if we see things pump, I will be moving to de-risk on a certain level before the start of next week. This doesn’t mean I’ll fully sell off into the move, but I will be looking to get significantly hedged at the very least. Watching for that flip of the grey box to signify continuation on the higher timeframes.

OTHERS Market Cap 12H Chart
Very similar setup here. Now we look for the break and close above the red line.
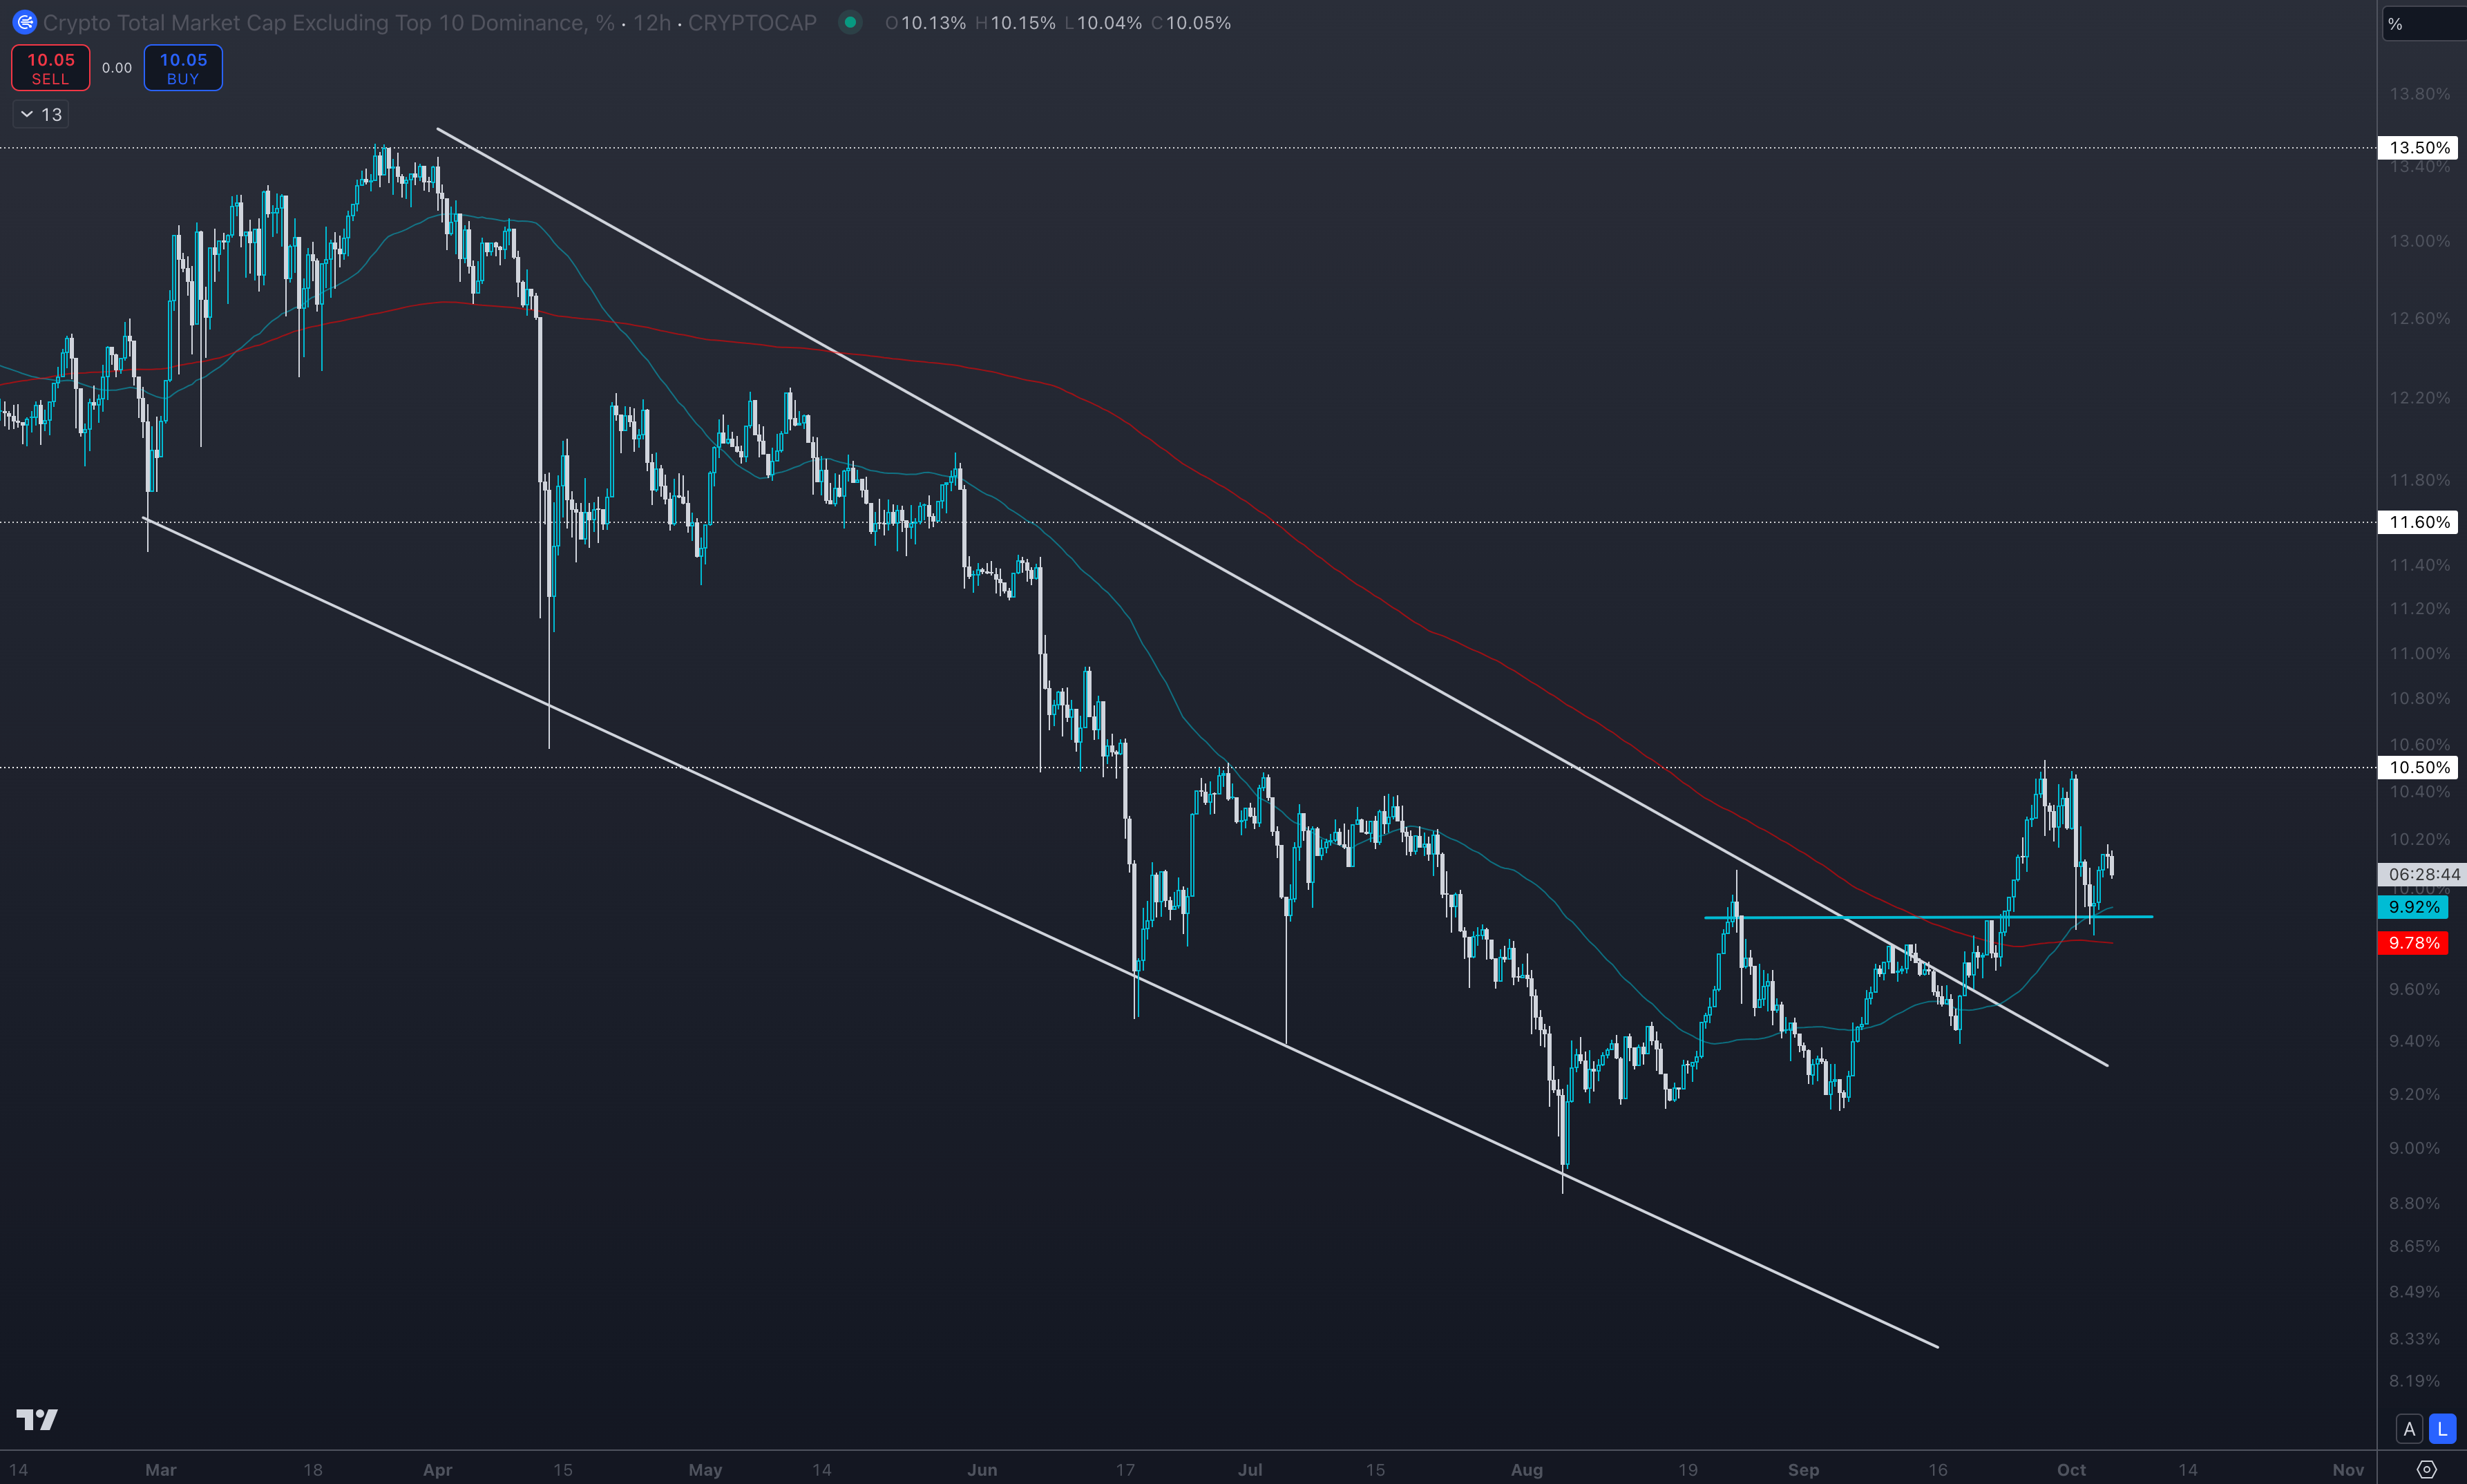
OTHERS.D 12H Chart
I quite like the look of altcoin dominance. Reclaim of 10.5% and it’s game on. Long way to go but I’ll remain cautiously optimistic. I’ve just noticed there’s a bullish cross of the 50/200MA, which further strengthens the bullish case here.
Upcoming Week
FOMC Minutes (Wed)
CPI (Thur)
PPI (Fri)
Michigan Consumer Sentiment (Fri)
What We’re Watching
Until recently, we’d been looking for poor economic numbers to trigger action from the Fed. Now it’s back to normal, and we’re cheering for strong prints to reaffirm the Fed’s path and increase the chances of a ‘soft landing’ where the US avoids recession or a deflation spiral. The FOMC minutes aren’t typically that hard-hitting as they’re more of a broad view of the consensus among the committee members. However the market sometimes trades tentatively leading up to the release. CPI and PPI are big hitters this week. We want to see gradual declines in these rather than a precipitous fall. Michigan Consumer Sentiment has been improving since the end of the covid era, and we want to see that trend continue. The market is betting 97% on a 25bps rate cut on Nov 7, so this data should not materially change the outlook unless we see a huge drop in CPI or PPI, which could send a warning to slow down.

Wrap
Am I still bullish here? Absolutely. Do I think BTC is gonna keep playing games with us? Definitely. But until the charts break down, I’m not ready to surrender my higher-timeframe outlook and Q4 seasonal strength tendencies reinforce this belief. However should we start closing daily candles below 59k for BTC I’ll be forced to pivot and add short exposure to protect my downside into those 55k and potentially 51k levels. I remain long altcoins and short on BTC so I’ll embrace the volatility. Thanks for reading and have a great weekend!