Retail Sales
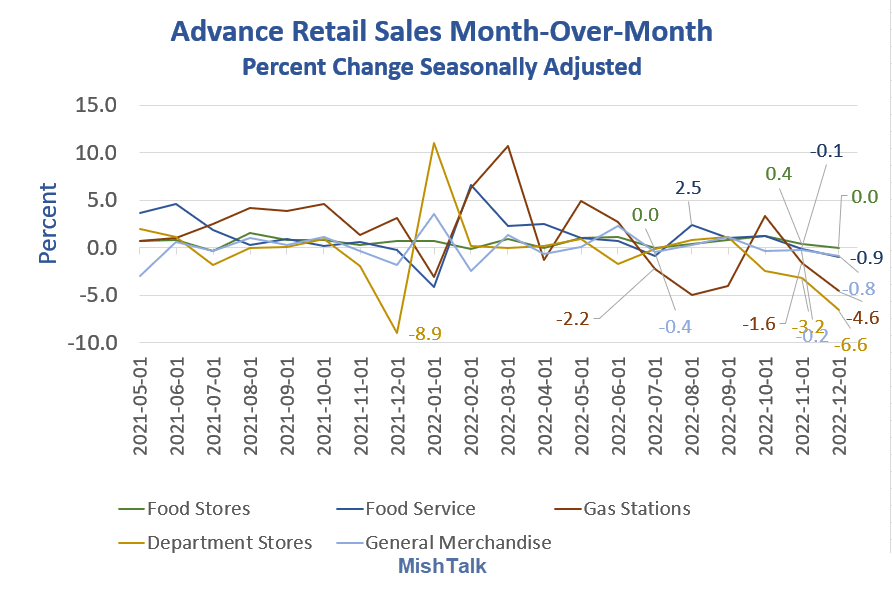
On Wednesday, the economy got another temperature check in the form of December retail sales. And man, the numbers were awful…
Last month people spent less on gas and more on food. This month consumers did not even spend more on food.
Check out department stores down a whopping 6.6 percent. General Merchandise was down 0.8 percent, That category includes Walmart and Costco.
And consumers spent 0.9 percent less eating out.
~ MishTalk
If consumers keep cutting their spending at this alarming rate, inflation is going to come down in a hurry and recession is closer than we thought…or already here.
Industrial Production
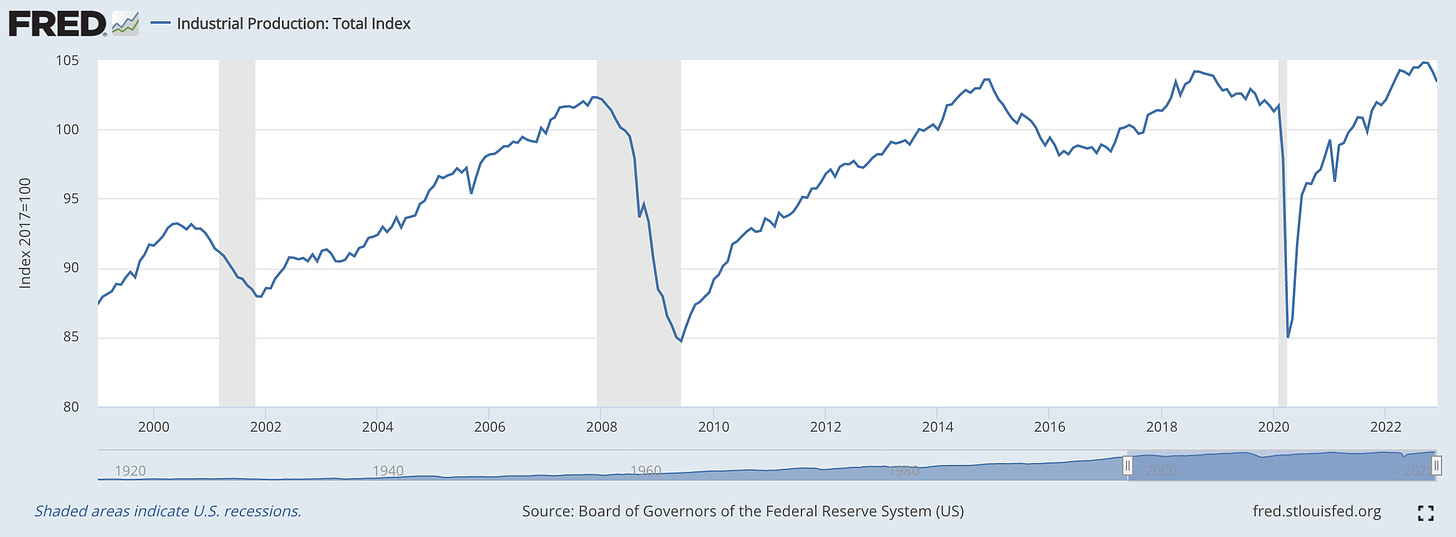
This chart is now on the decline, and once it starts to drop it usually gains momentum. Industrial production clearly peaked in October and it’s likely to get a lot worse before it gets better.
Peaks in IP tend to lead recessions by a few months.
Then there’s housing…
Home Sales
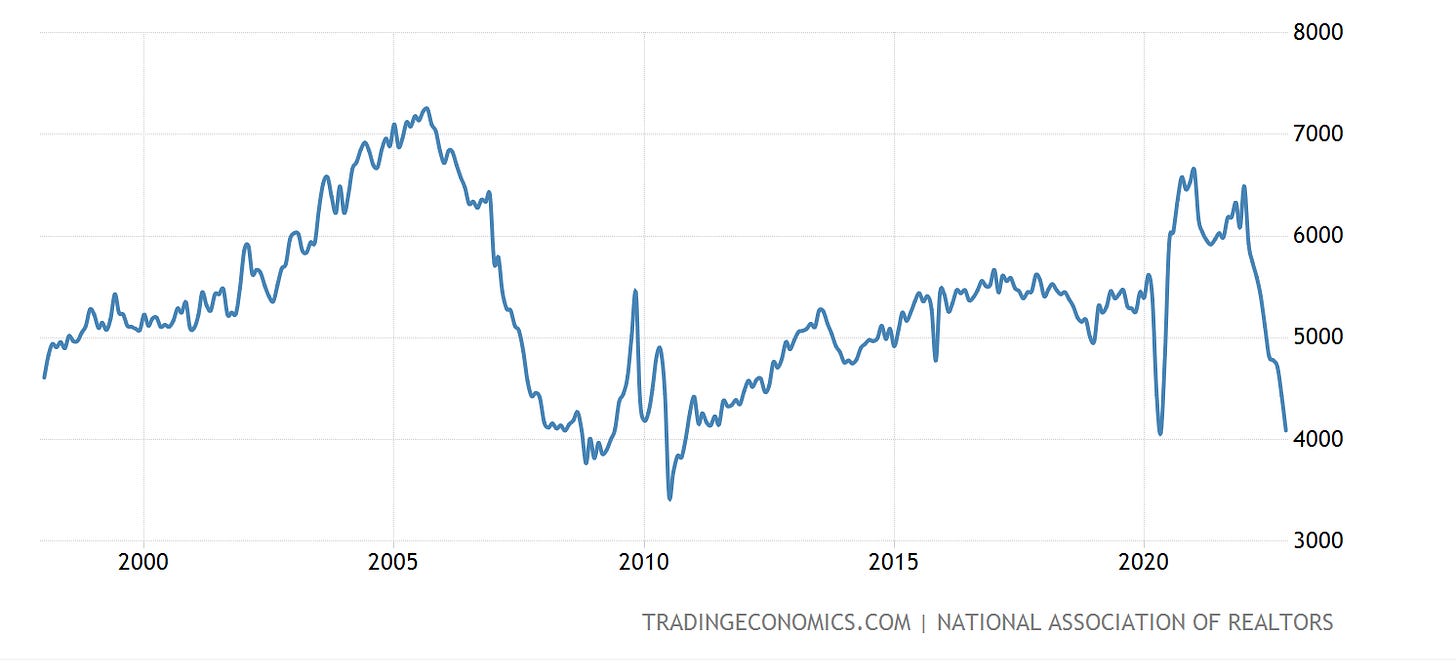
Existing home sales have declined 37% since last January, and we have yet to see December’s data.
With retail sales, industrial production, and housing starts all falling precipitously, the current administration is being dishonest in telling us the economy is “strong as hell”. It’s looking more like the opposite.
Debt Ceiling
Oh and the government is out of money…again.
The United States hit its technical debt limit on Thursday, prompting the Treasury Department to begin using “extraordinary measures” to continue paying the government’s obligations.
Those are essentially fiscal accounting tools that curb certain government investments so that the bills continue to be paid.
Those options could be exhausted by June, Ms. Yellen told Congress last week.
~ NY Times
Nobody really knows what would happen if the US were to actually default on its debts. They will need to raise the ceiling again or do away with it altogether. But with Republicans wanting budget reforms and Democrats not offering contingencies, it’s setting up to be quite the face-off.
Stay tuned…
Technical Analysis Corner
BTC Daily Chart
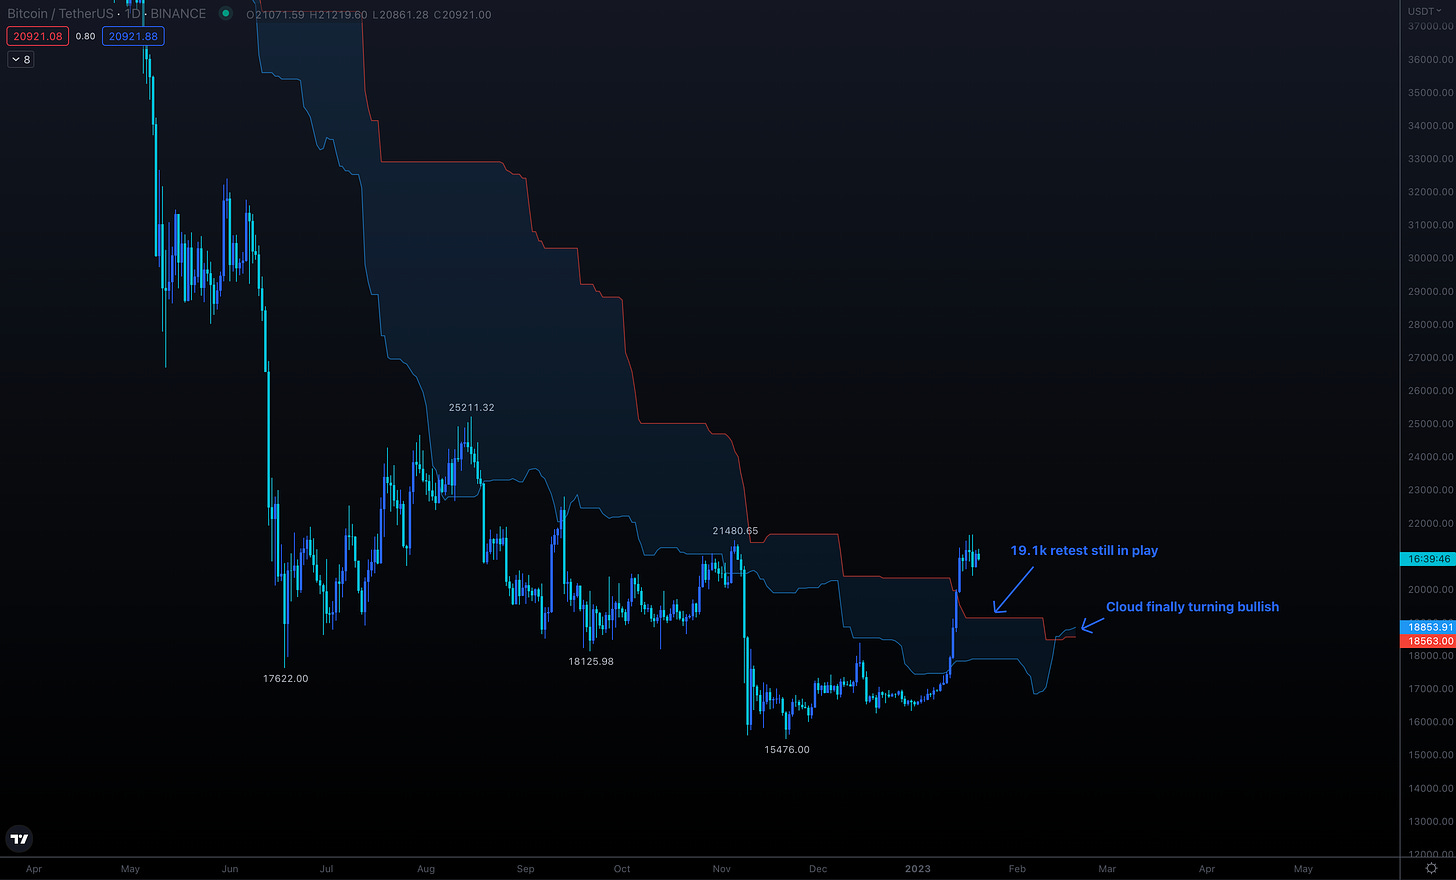
In my last update, I mentioned the 20,300 and 21,480 targets. Both were reached and we are now consolidating sideways.
Now that price is out of the cloud, we also have the bullish future Kumo twist where the blue line has flipped over the red one. This often signals the end of a trend. It initially flipped bearish around 54k, so you can see the significance.
With that said, we need to set a higher low sooner or later, and I’m eyeing the flat top levels at 20.3k and 19.1k as potential targets.
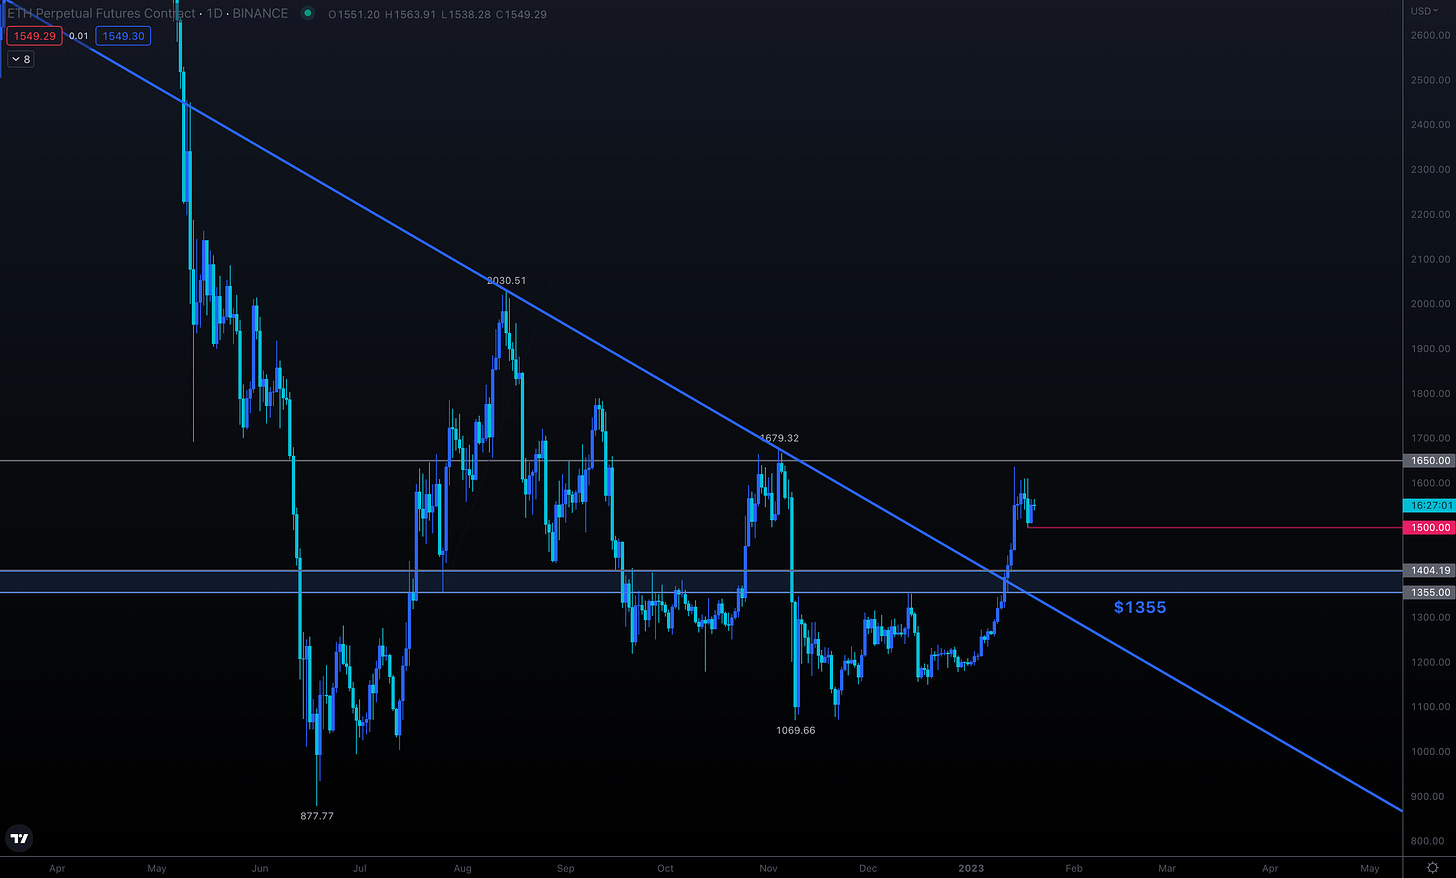
ETH Daily Chart
If Ethereum can hold $1500 it should advance toward $1650. Otherwise I’d be looking for a correction toward the blue shaded area.
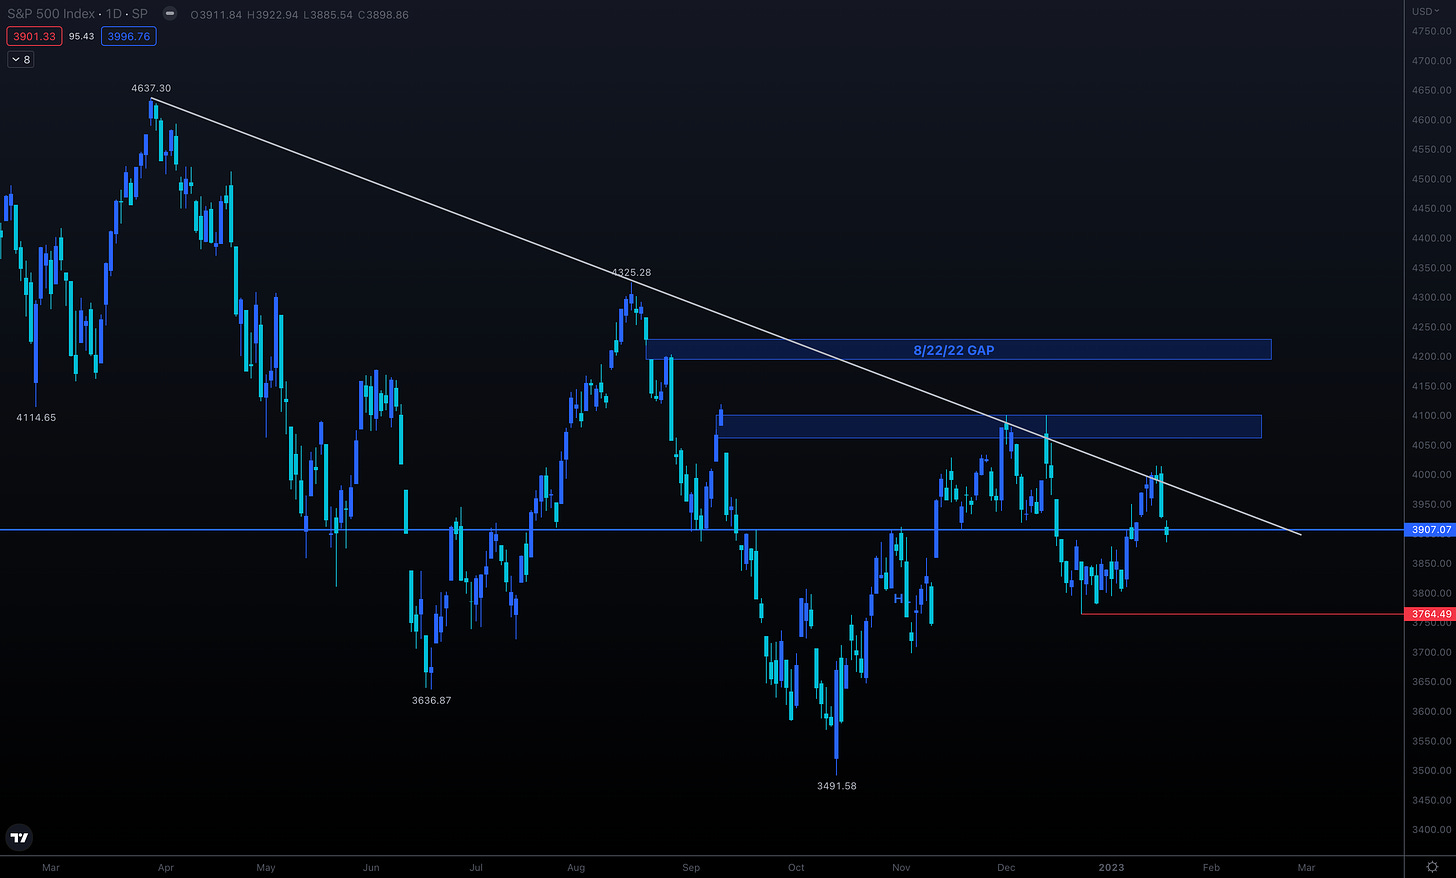
SPY Daily Chart
I’m not in love with the fact it’s losing support. The bounce was very weak, and I believe that’s due to the economic data out this week. The market is starting to pivot and react negatively to bad news like the awful December retail sales print.
Bulls need to show renewed strength with a close above 3960 diagonal resistance. If successful I’ll be looking for 4070-4100 and 4200 area beyond that. 3764 needs to be held or things could get ugly and we’ll swing from green to red in January.
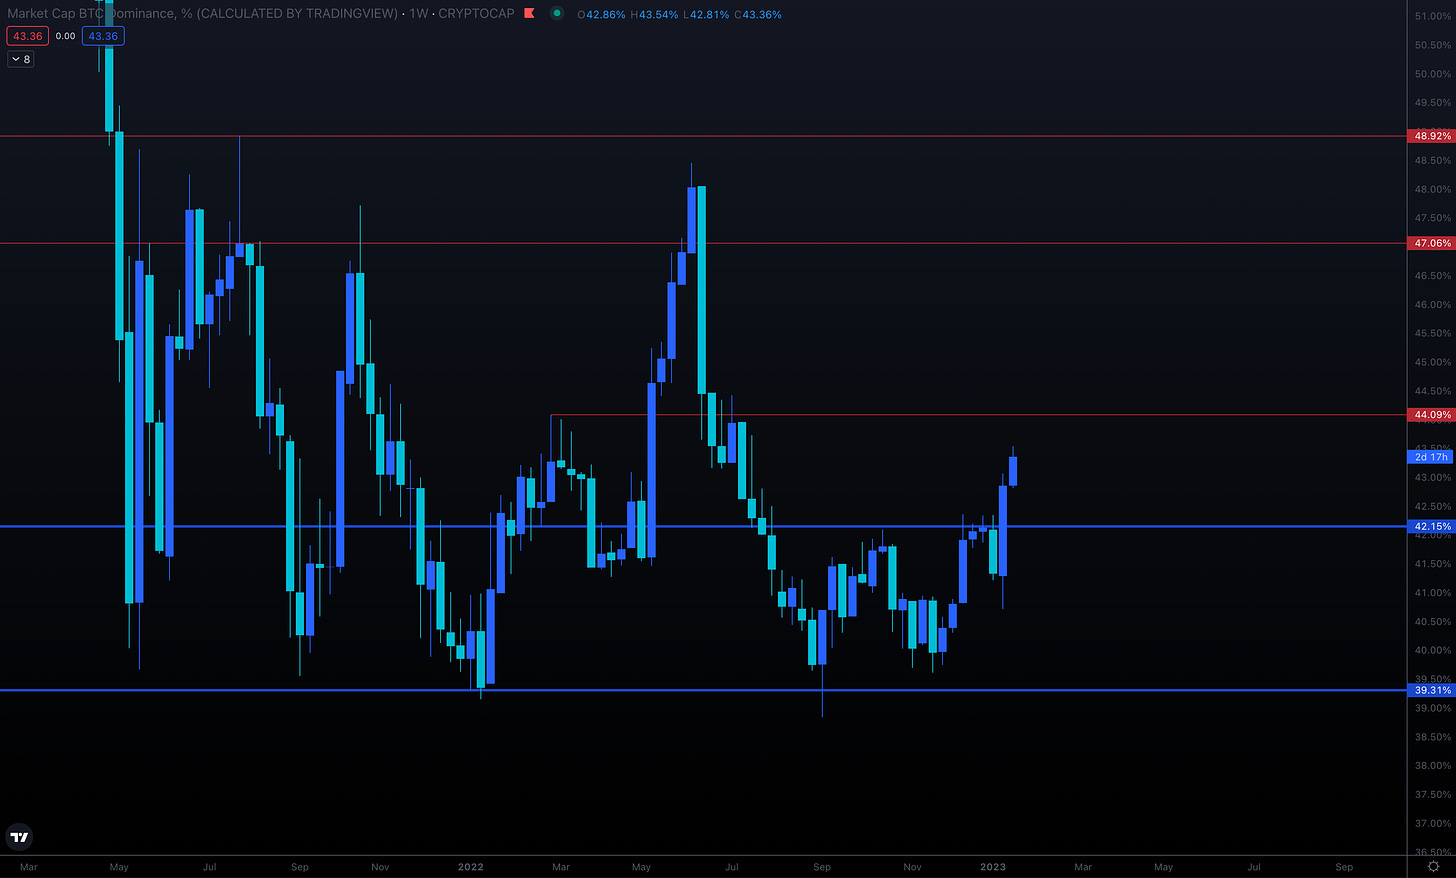
BTC.D Weekly Chart
Bitcoin dominance is still showing strength and confirming last week’s breakout. There’s lots of air above 44, so altcoin hunters will want to see a rejection there.
A lot of Twitter influencers want to shill alts and microcaps, but they’re still highly speculative as long as BTC.D is rising.
Next week we have a PCE inflation report on Friday. We should start to get some more volatility again. Fun times!
Jay Charles
Editor in Chief, The Trading Tank.
Disclaimer: The publisher does not guarantee the accuracy or completeness of the information provided in this page. All statements and expressions herein are the sole opinion of the author.
The Trading Tank is a publisher of financial information and not an investment advisor. We do not provide personalized or individualized investment advice or information that is tailored to the needs of any particular recipient.
THE INFORMATION CONTAINED ON THIS WEBSITE IS NOT AND SHOULD NOT BE CONSTRUED AS INVESTMENT ADVICE. INVESTORS SHOULD MAKE THEIR OWN INVESTIGATION AND DECISIONS REGARDING THE PROSPECTS OF ANY COMPANY OR PUBLICLY TRADED ASSET DISCUSSED HEREIN BASED ON SUCH INVESTORS’ OWN REVIEW OF PUBLICLY AVAILABLE INFORMATION AND SHOULD NOT RELY ON THE INFORMATION CONTAINED HEREIN.



Great Analysis as always, thank you!